 Login
Login Field-Map Project Manager (FMPM)
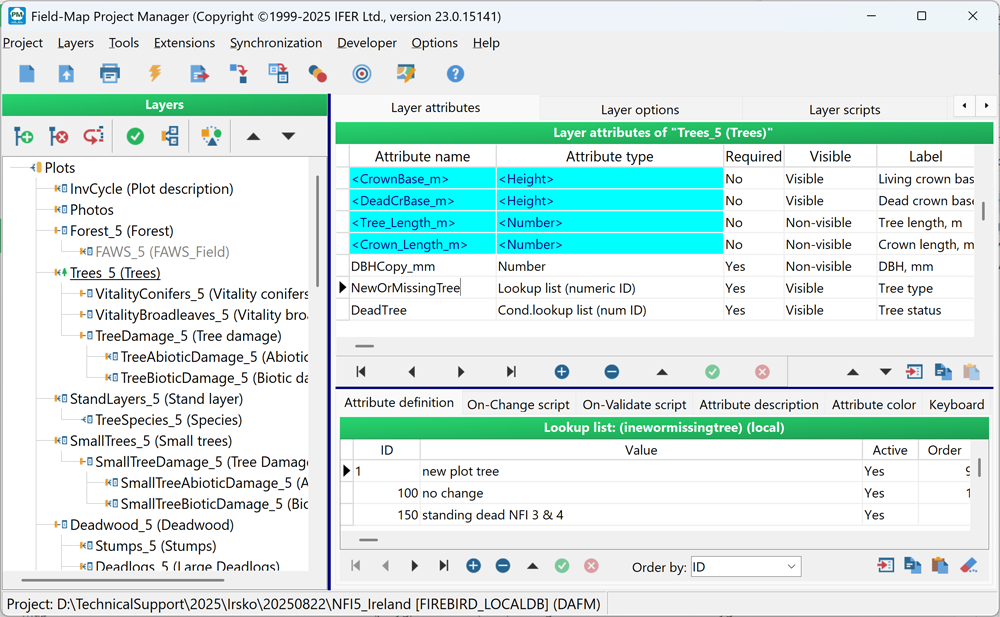
Using FMPM, the user can easily define a structure of a database (i.e. Field-Map project) based on his/her own methodology.
Within one project, user can define many different layers with many different attributes. Field-Map supports multi-level relational database.
A user can define shape and location of many plots or study sites within a single project.
Using FMPM the project preparation is very fast and intuitive. No programming is necessary to develop a custom software application.
Detail list of FMPM features:
- Flexible system
- No programming skills required
- Relational database
- Open environment
- Number of attribute types
- Export to industry standard formats
- Support for multiple team field work
With FMPM you can easily define the shape and size of inventory plots, attributes to be measured in the field, lookup lists with predefined values, mutual relations between attributes and more. Thus the database becomes adjusted to your methodology and not the other way around.
To develop field data collection projects you need to define database structure of the project. With FMPM you do not need any programming skills to achieve that.
Multiple layers arranged in database structure supporting one-to-many, one-to-one and many-to-one relationships.
If you want to extend Field-Map capabilities, you can write your own scripts in Object Pascal and embed them in the project.
Types of simple attributes include number, string, logical, date, time, picture, movie, voice memo, height, diameter and length.
Then there are lookup tables and conditional lookup tables, which are user defined lists of values.
Export to MS Access, Paradox, Excel, DBase, XML and Shapefiles
Automatically synchronize and backup data from many teams into a single database.
- Checking the data
- Design network of inventory plots
- Support for repeated measurements
- Using digital background map
- Conversion between co-ordinate systems
- Print project structure
Various data checking routines are included in Field-Map ranging from simple checks such as checking the type of the variable to more advanced checking routines involving values and conditions from more attributes.
With create set of plots function you can create collection of plots with predefined parameters. You can have different parameters for specific parts of the plot (e.g. concentric circles where trees of certain dimensions are to be measured. Automatic checks are then performed in the field)
repeated measurement of trees on permanent plots is supported by number of functions. The previous measurements are dynamically linked to current measurements enabling online verification of the parameters.
You can define collection of aerial images and shapefiles to show in the background of your map screen.
You can convert geographical data from local co-ordinates to any map projection
Structure of your project can be printed or saved to PDF for use in your project reports.